In today’s fast-moving financial markets, investors face a common challenge: too much data, but not enough clarity. Between complex charting tools, paid research platforms, and opinion-heavy financial media, many individuals struggle to find a tool that delivers accurate insights without unnecessary complexity.
This is where StockAnalysis.com stands out.
Unlike platforms that overwhelm users with noise or expensive features they may never use, StockAnalysis.com focuses on what truly matters — clear financial data, logical structure, and actionable insights. Whether you are a beginner learning how to analyze stocks or a seasoned investor refining long-term strategies, this platform offers a surprisingly powerful toolkit.
In this in-depth review, we’ll analyze what StockAnalysis.com is, how it works, who it’s for, its strengths and weaknesses, pricing, and how it compares to competitors — so you can decide whether it deserves a spot in your investment workflow.
 What Is StockAnalysis.com?

StockAnalysis.com is a web-based financial research platform designed to help users evaluate stocks using fundamental data, historical performance, and valuation metrics.
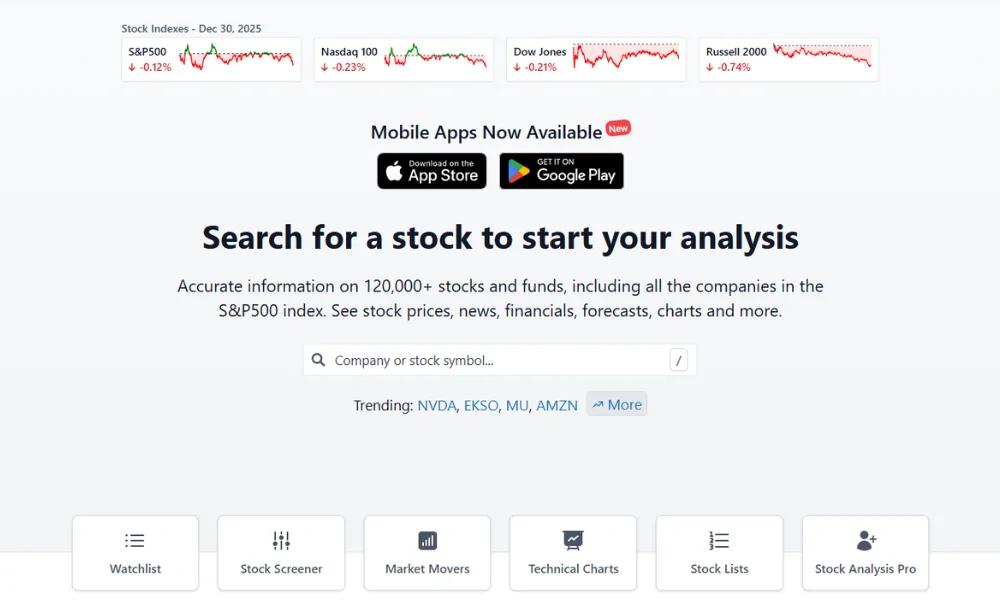
Rather than acting as a trading platform, StockAnalysis.com serves as a decision-support tool. It helps investors answer questions such as:
-
Is this company financially healthy?
-
Is the stock overvalued or undervalued?
-
How does this company compare to competitors?
-
Has the business been growing consistently?
The platform focuses on clarity, accuracy, and accessibility, making it ideal for investors who want data without unnecessary distractions.
Core Philosophy: Simplicity Without Sacrificing Depth

StockAnalysis.com is built around a simple idea:
Good investment decisions come from understanding the numbers, not reacting to hype.
Unlike many platforms that prioritize news feeds or speculative commentary, StockAnalysis emphasizes:
-
Structured financial data
-
Historical context
-
Logical comparisons
This philosophy makes it especially useful for investors who value fundamentals over speculation.
Key Features & Functional Overview

1. Financial Statements & Historical Data
 1. Financial Statements & Historical Data
StockAnalysis.com provides detailed access to:
-
Income statements
-
Balance sheets
-
Cash flow statements
Users can view multi-year data to identify trends in revenue growth, margins, expenses, and profitability. This historical depth helps investors understand how companies perform across economic cycles.
2. Valuation Metrics & Financial Ratios
 2. Valuation Metrics & Financial Ratios
The platform offers a comprehensive set of valuation indicators, including:
-
Price-to-Earnings (P/E)
-
Price-to-Book (P/B)
-
Return on Equity (ROE)
-
Free Cash Flow
-
Debt-to-Equity ratios
These metrics help investors assess whether a stock is undervalued or overpriced relative to fundamentals.
3. Visual Charts and Performance Tracking
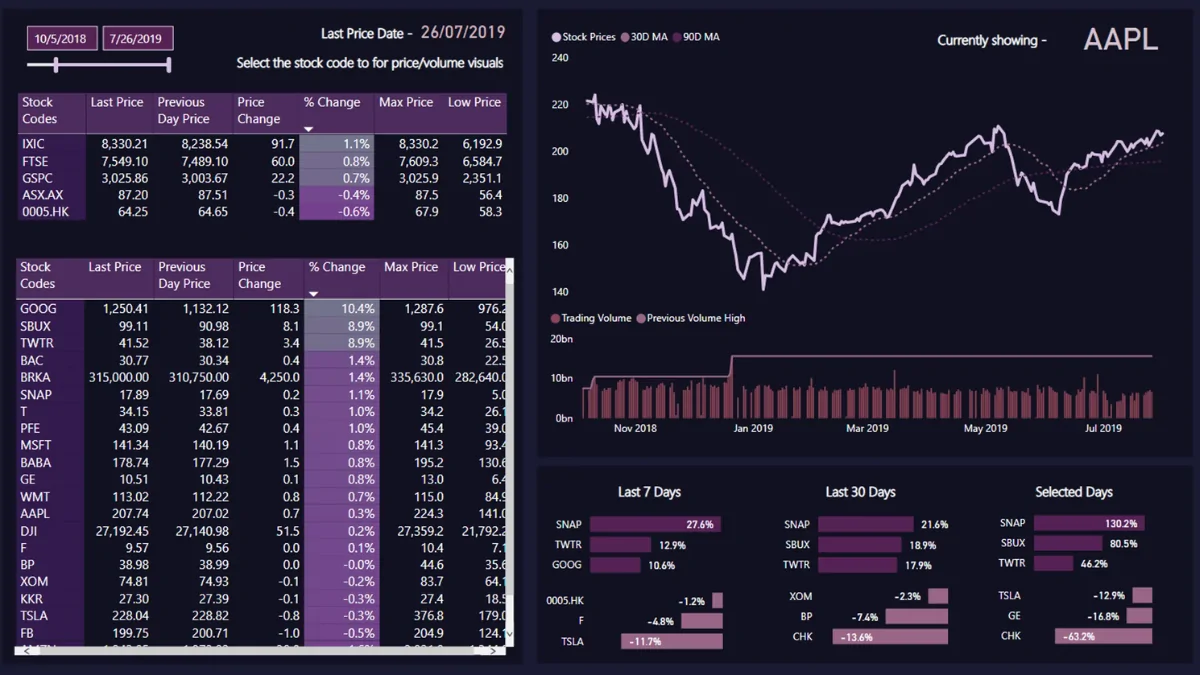
Charts on StockAnalysis.com are clean, minimal, and easy to interpret. Rather than overwhelming users with technical indicators, the platform focuses on:
-
Price history
-
Revenue growth
-
Earnings trends
This design makes it ideal for investors who want clarity without unnecessary complexity.
4. Stock Screener for Discovery
 4. Stock Screener for Discovery
The built-in stock screener allows users to filter companies using criteria such as:
-
Market capitalization
-
Sector and industry
-
Growth metrics
-
Profitability levels
This feature is particularly useful for discovering new investment opportunities aligned with personal strategies.
Pricing Structure: Free vs Paid


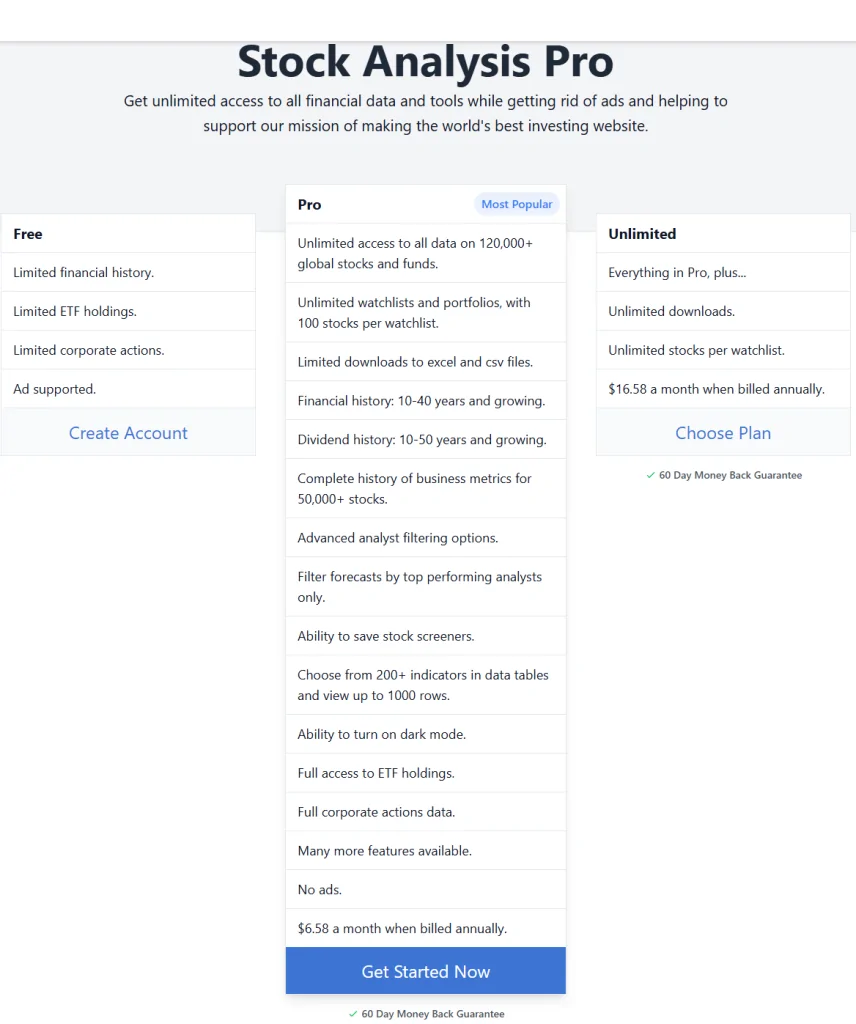
One of the strongest advantages of StockAnalysis.com is its transparent pricing model.
Free Version
 Free Version
Includes:
-
Financial statements
-
Core ratios
-
Stock screener
-
Company comparisons
For most investors, the free version alone provides more than enough value.
Pro Version
 Pro Version
The paid plan (typically around $79/year) unlocks:
-
Extended historical data
-
Advanced filtering options
-
Export functionality
Compared to competitors charging hundreds per year, StockAnalysis.com remains extremely affordable.
Who Should Use StockAnalysis.com?

Ideal For:
 Ideal For:
-
Long-term investors
-
Value investors
-
Portfolio builders
-
DIY investors
-
Beginners wanting to learn financial analysis
Not Ideal For:
 Not Ideal For:
-
High-frequency traders
-
Day traders needing real-time execution
-
Users dependent on automated signals
StockAnalysis.com vs Competitors

| Platform | Best For | Pricing | Learning Curve |
|---|---|---|---|
| StockAnalysis | Fundamental analysis | Free / Low | Low |
| Seeking Alpha | News & opinions | Medium–High | Medium |
| Morningstar | Institutional research | High | High |
| Yahoo Finance | Quick overviews | Free | Very Low |
| Finviz | Technical screening | Free / Paid | Medium |
Why StockAnalysis Stands Out:
-
Clean interface
-
No aggressive paywalls
-
Strong data reliability
-
Perfect balance between simplicity and depth
Real-World Use Case Example

Imagine you’re evaluating whether to invest in a mid-cap technology company.
Using StockAnalysis.com, you can:
-
Review 10 years of revenue and earnings growth
-
Compare margins against industry averages
-
Evaluate debt levels and cash flow health
-
Compare valuation ratios with competitors
Within minutes, you gain clarity that would otherwise take hours of manual research.
Pros & Cons Summary

Pros
-
Extremely user-friendly
-
Excellent free tier
-
Clean financial data presentation
-
Ideal for long-term investing
-
Affordable premium plan
Cons
-
No real-time trading data
-
Limited advanced analytics
-
Not built for intraday traders
Final Verdict: Is StockAnalysis.com Worth It?

Absolutely.
StockAnalysis.com delivers exactly what long-term investors need: clarity, structure, and reliability. It doesn’t try to replace trading platforms — instead, it enhances decision-making by providing high-quality financial insights in a clean and accessible format.
If your goal is to make smarter, data-driven investment decisions without paying premium prices, StockAnalysis.com is an excellent choice.
Explore More Expert Reviews
 Explore More Expert Reviews
Want more in-depth breakdowns like this?
 Visit https://toptradingfunds.com/
We publish unbiased, in-depth reviews of investment tools, SaaS platforms, and financial software — helping you choose smarter and invest with confidence.